To commemorate International Women’s Day, I took a look at the statistics around undergraduate admissions to study engineering. There have been many efforts made over the past decade, and longer, to increase the number of women studying engineering – the department and student societies hold talks, outreach events and more. But is this resulting in more women being admitted?
First, let’s start with a few brief definitions of the data provided by the university:
Applications: the number of people who submitted an application to the University of Cambridge to study the Engineering Tripos
Offers: the number of people who were given an offer (conditional or unconditional) to study the Engineering Tripos
Acceptances: the number of people who both accepted their offer (and did not choose to go to another university) and also achieved the terms of their offer (usually specified A Level grades and, in the case of some colleges, STEP).
Year: refers to offers made for that year, e.g. 2003 means offers made to commence study in October 2003, or deferred offers to start in 2004 (though these account for a very small number).
Taking a look at the overall number of applications, it is clear that applications have increased annually for the past 20 years. Applications from male and female students have both increased, however the proportion of applications from each group has remained very similar.
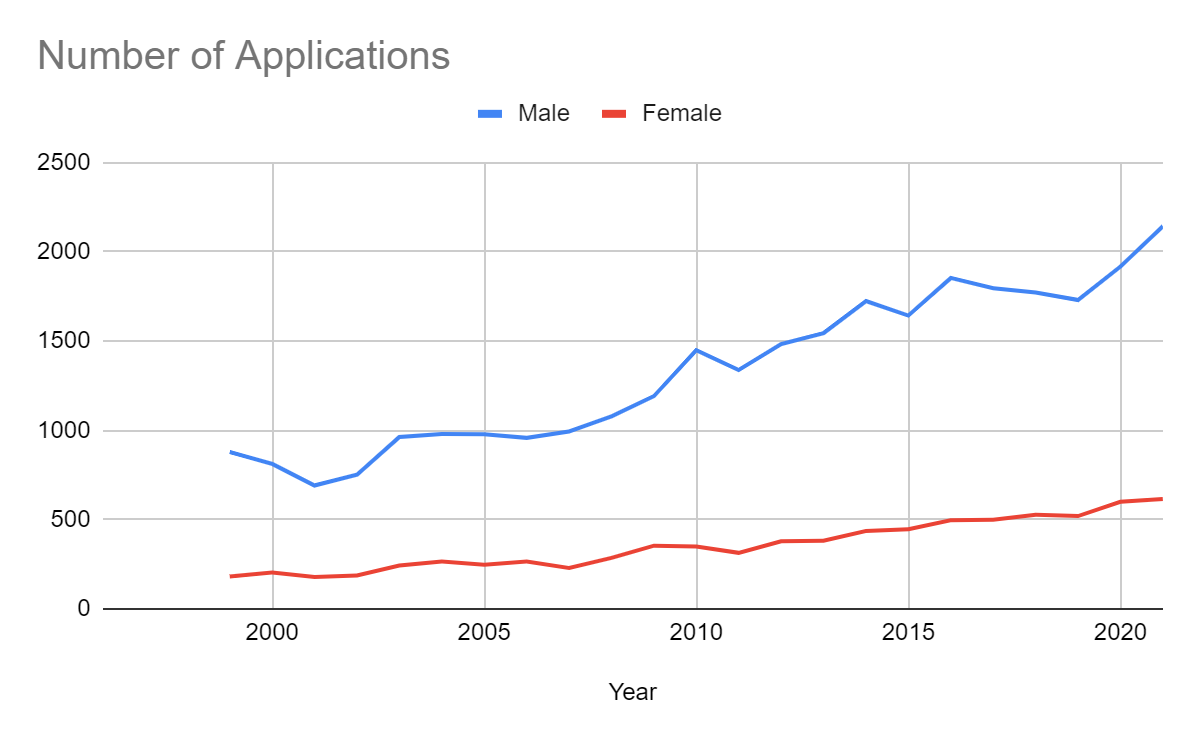
In 2021, the most recent year for which data is available, there were 2143 applications from men and 616 from women, whereas in 2001 the numbers were 691 vs 179. This remains broadly in line with the proportion of girls studying A Level Physics (though it should be noted that a slightly higher proportion of girls achieve grade A or above than boys).
Data on the number of offers made is only publicly available for 2014 onwards. The graph below shows offers (as a percentage of total number of offers) and acceptances (as a percentage of total number of acceptances) for female students.
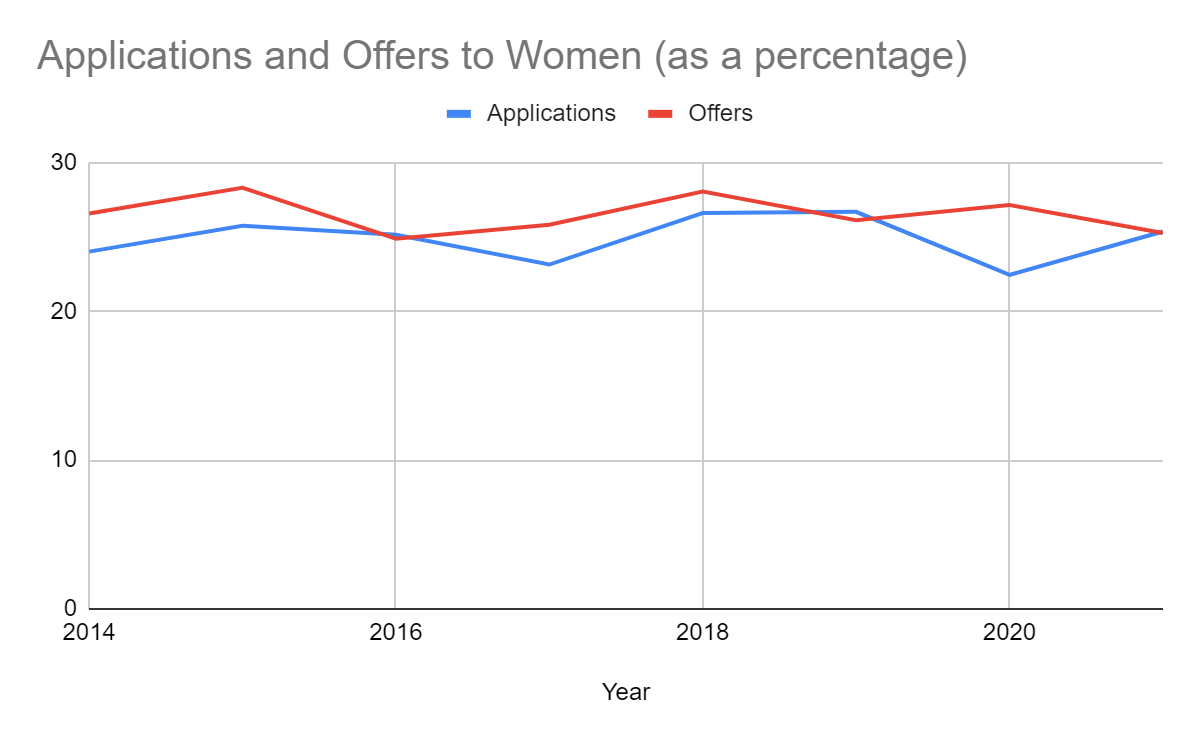
This graph demonstrates that if there is any attempt to redress the gender balance, it is not evident from the data. Some may view this as fair – places are offered in proportion to applications, whereas others may see this as a self perpetuating cycle (less women apply because there are less women, so less women apply etc). Personally I think compared to the strategy used to address disadvantage due to school background across the university, which has resulted in large changes in the proportion of state vs privately educated students, the engineering department falls woefully short.
Finally, we come to what I think is the most striking graph of all – proportion of total acceptances.
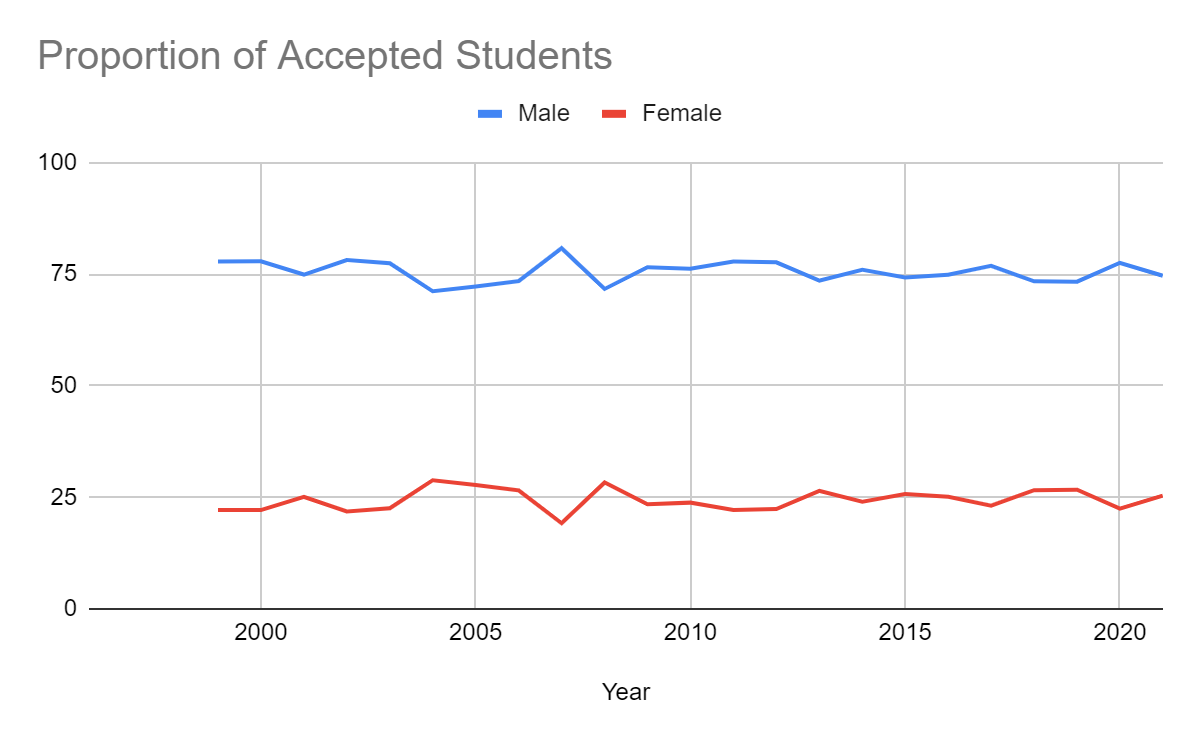
I think it would be difficult to describe the proportion of incoming female undergraduates since 1999 as anything other than completely stagnant. There has been some variation, with the percentage of women reaching a notable(!) high of 28.8% in 2004, however the overall trend is bleak. Perhaps naively, I had imagined that over more than 20 years (more than my entire lifetime), there had been some progress.
Now, it would be wrong to lay all of the blame for this trend on the Department of Engineering and individual colleges. There is still a long way to go to redress the balance of women studying A Level Physics, and who then go on to choose to study engineering. This is a change that has to start at the youngest ages – primary school children are still much more likely to draw a man when asked to draw a scientist. But this doesn’t mean there is nothing that the university can do.
It is important to note the disparity between different colleges when it comes to female students – for example in 2nd year at Homerton I am one of only 3 female engineers (out of 22). On the other hand, some colleges manage to achieve an almost 50/50 split. In conversations with other female engineers, the question about the split at our respective colleges is a very common topic – and I believe there should be more transparency and scrutiny of this on a departmental level.
It is a myth that progress is inevitable with the march of time – progress is difficult, it is something we have to fight for. Many individuals have worked tirelessly to increase the number of state educated students at the university, and although this fight has a long way to go it has nevertheless achieved much more change than the struggle for more female engineers.
I don’t pretend to have all the answers but I think it all comes down to this: in another 20 years time, would we (as students, faculty and industry) be happy if the graph continues along the same trajectory? And if not, what has to change?